Quick summary if you only have 30 seconds
If you are a founder, marketer, or GTM lead trying to reach the right companies in the EU’s geospatial, agricultural intelligence, and earth observation space, the core problem is always prioritization: who are these companies, what do they look like, and where do you start?
We analyzed 1,922 companies across the EU operating in markets tied to Crop Insurance, Automation & Monitoring, Earth Observation, Development Management, Project Management, Business & Development, Agricultural Insurance, Improvement Application, Data Services, and Hail Damage. Combined, these companies generate $47,544,523,635 in total revenue.
Our anchor for this analysis is Kappazeta, an Estonian company based in Tartu, operating at the intersection of radar satellite imagery processing, earth monitoring, and agricultural event detection. It employs 25 people and reported $1,827,527 in revenue, placing it squarely in the SMB tier that accounts for the largest share of this market.
What you get from this article: a clear market snapshot, a data-grounded method for defining your ICP, GTM angles tailored to this specific market structure, and concrete insights to inform your next strategic decision. Every number here traces directly to the structured firmographic and revenue dataset we pulled for this analysis. No gut feel. No invented benchmarks.
The ICP anchor: why we start from one company
Starting from a single company is not an arbitrary choice. An anchor company gives you a concrete reference point for understanding how the broader market is structured around it. It tells you what a real participant in this space looks like: how it earns revenue, what problems it solves, how many people it employs, and where it operates. From that fixed point, you build outward.
Kappazeta (legally registered as KappaZeta OÜ, also commercially known as KappaOne) was founded in 2015 and operates out of Tartu, Estonia at Kastani 42, 50410, Tartu maakond. It employs 25 people and reported revenue of $1,827,527. The company sits within the Surveying Services business category under the broader Architecture & Engineering Services sector, with a primary NAICS classification of 541360, Geophysical Surveying and Mapping Services. No secondary NAICS codes are recorded, which reflects a single-discipline operational model rather than a diversified service portfolio.
What Kappazeta actually does is precise. It delivers an API that processes radar satellite data and produces time-series outputs for higher-level applications. Those outputs are built to detect biomass changes, farming events such as haying, harvesting, and ploughing, and natural damage events, including flooding and hail impact. The company synthesizes high-resolution biomass estimate images from radar data and combines them with cloud-free optical sources to generate synthetic cloud-free NDVI imagery for a specified area of interest. The core positioning argument is that satellite data is the most cost-effective source for large-scale earth monitoring.
Its operational focus spans a tightly defined topic set: Crop Insurance, Automation & Monitoring, Earth Observation, Development Management, Project Management, Business & Development, Agricultural Insurance, Improvement Application, Data Services, and Hail Damage. That combination signals a niche but commercially relevant position in agri-tech and geospatial intelligence.
Kappazeta maintains one recorded office location in Estonia. That single-country footprint places it firmly within the EU region and aligns with Estonia’s established profile as a hub for digital-first, technology-driven startups.
Understanding what Kappazeta represents within a market of 1,922 companies and $47,544,523,635 in combined revenue requires stepping back. The sections that follow map the full structural and competitive landscape around it.
How we built the dataset (method and quality checks)
The dataset for this analysis was built using Veridion, a structured company intelligence platform that aggregates firmographic, financial, and operational data across global business registries and commercial sources.
To scope the EU market relevant to Kappazeta’s operating context, we applied a layered filtering methodology. The primary filter used NAICS code 541360, Geophysical Surveying and Mapping Services, as the anchor classification, supplemented by adjacent NAICS codes, including Custom Computer Programming Services, Computer Systems Design Services, Environmental Consulting Services, and Engineering Services, to capture the full ecosystem of firms operating at the edges of core geospatial work.
On top of the NAICS filter, we applied a keyword and business tag match across ten topic areas: Crop Insurance, Automation & Monitoring, Earth Observation, Development Management, Project Management, Business & Development, Agricultural Insurance, Improvement Application, Data Services, and Hail Damage. These tags are drawn from Veridion’s structured classification system and represent either declared business capabilities or industry-specific positioning signals recorded at the company level.
Geographic scoping covered the EU region. It is worth noting that company location in this dataset reflects registered or primary office presence. Because companies frequently maintain multiple offices across countries, the selected region does not restrict which companies are included based on the location of secondary offices alone. A company registered in Germany with offices in Poland and Spain is counted once, in Germany, its primary location.
The final export produced 1,922 companies with usable firmographic records. Revenue data is present across the full sample, though the degree of precision varies. Some revenue figures are reported directly from company filings, while others are modeled estimates. This is a standard limitation of large-scale commercial datasets and does not materially affect the directional conclusions of this analysis, but you should treat individual revenue figures as indicative rather than audited. Employee counts follow the same pattern.
The short version of the data analytics
- The market spans 1,922 companies generating $47.5B in total revenue, with 94% of companies classified under NAICS 541360, Geophysical Surveying and Mapping Services.
- 73% of companies employ fewer than 50 people, and 90% generate under $10M in annual revenue, confirming a fragmented market dominated by specialist boutiques and niche technical providers.
- Germany (355 companies), the UK (297), and France (288) together account for 48% of all companies, establishing Western Europe as the clear center of commercial density.
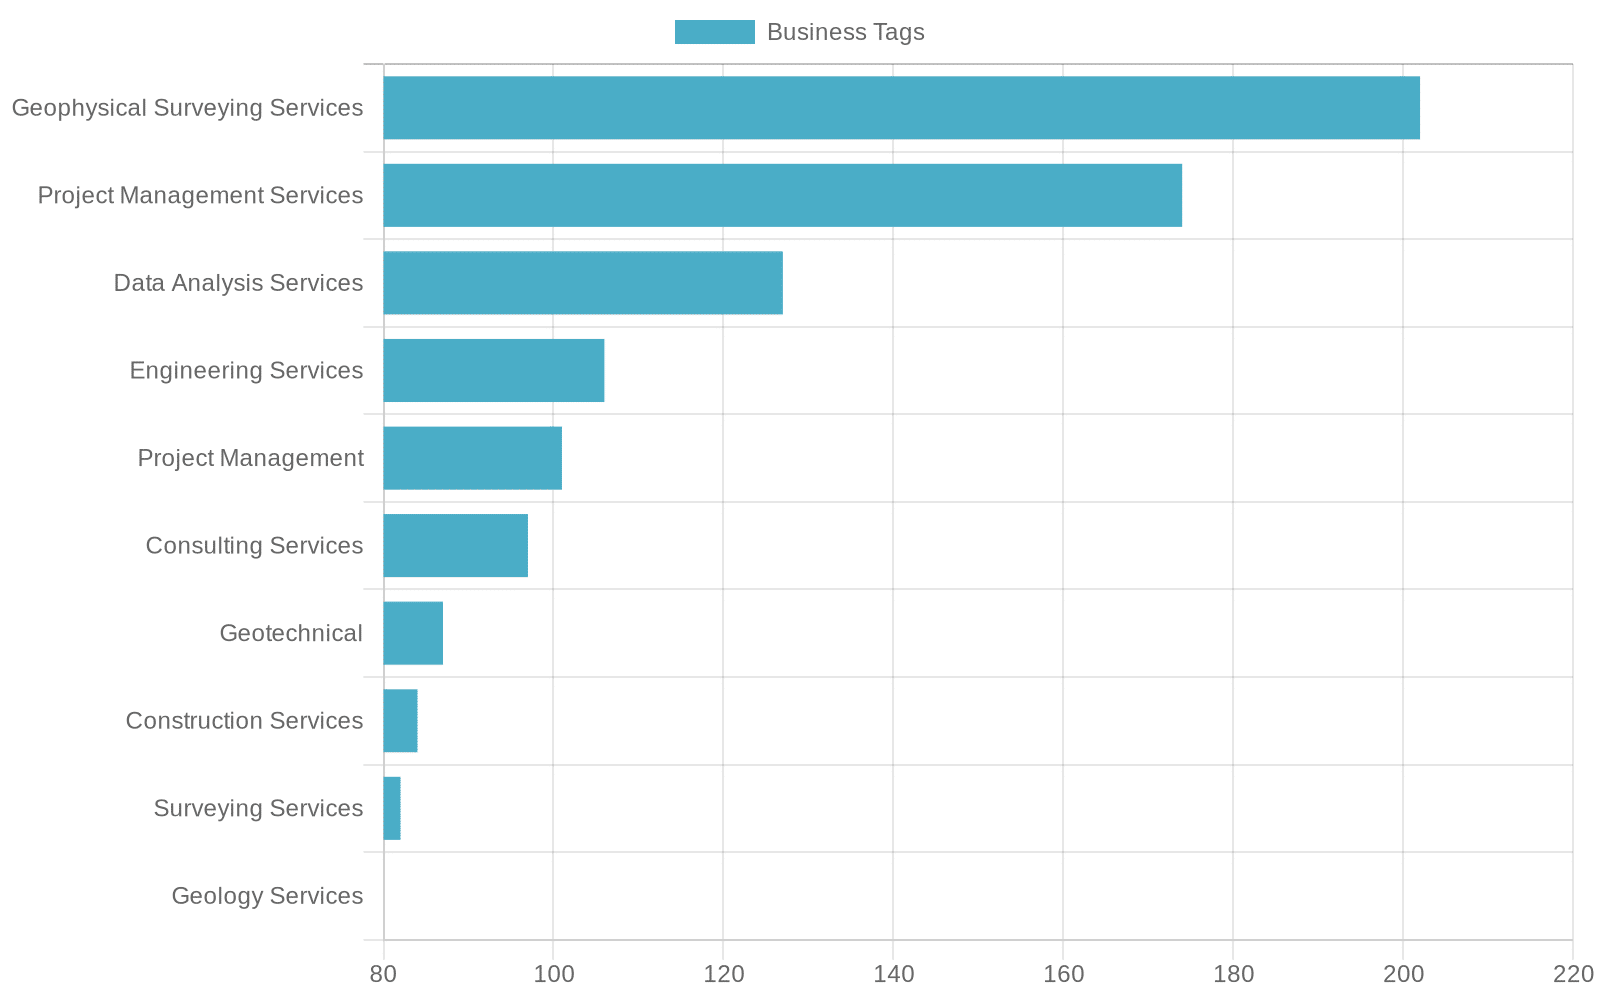
- The four strongest capability signals across the dataset are Data Analysis Services (127 companies, 7%), Research & Development (77 companies, 4%), Custom Programming Services (69 companies, 4%), and Remote Sensing (75 companies, 4%), pointing to a market that increasingly generates margin from data interpretation and software tooling rather than raw data acquisition.
- Only 23 companies exceed $50M in annual revenue, meaning the top roughly 1% of the sample carries a disproportionate share of the market’s $47.5B total.
The importance of the industry of the company
Geophysical Surveying and Mapping Services sits at the intersection of spatial intelligence and applied science. Two forces have consistently driven its expansion: the rapid commercialization of satellite infrastructure, which has made high-resolution earth observation data broadly accessible, and the growing regulatory and financial pressure on agriculture-dependent economies to quantify environmental risk with greater precision. Both forces have elevated geospatial intelligence from a niche technical discipline into a foundational layer for decision-making across insurance, land management, and infrastructure development.
Within this broader field, the Surveying Services segment has evolved considerably. Business tags such as Remote Sensing, Data Analysis Services, and Geophysical Surveying Services reflect a market that has moved well beyond traditional field-based measurement into automated, satellite-driven workflows. Three recurring forces shape this transformation: the shift from manual data collection to API-delivered time-series imagery, the integration of radar and optical data sources to produce cloud-free biomass estimates for agricultural monitoring, and the expansion of crop insurance and hail damage assessment use cases that demand near-real-time field intelligence.
These forces are reshaping how surveying firms position their services and what technical capabilities clients now expect as standard. A company like Kappazeta, which delivers processed satellite data via API rather than field teams, is not an outlier in this market. It is an early representation of the direction the segment is moving.
The topic tags applied to this dataset, from Crop Insurance and Agricultural Insurance through to Hail Damage and Earth Observation, are not arbitrary groupings. They trace the commercial applications that are pulling geospatial data work into adjacent industries. Insurance underwriters need crop damage data at field resolution. Land management authorities need biomass change detection across large areas. Agricultural operators need event timing, when a field was ploughed, when hail struck, how much yield was lost. The companies in this dataset are building the data infrastructure that makes those use cases possible.
—
Market composition: size and revenue bands
The EU market spanning these ten industry tags collectively generates $47,544,523,635 in total revenue across 1,922 active companies. That scale reflects sustained institutional and commercial investment in geospatial intelligence, agricultural risk management, and earth data services across Europe. The industry is not nascent. It is established and, structurally, heavily fragmented.
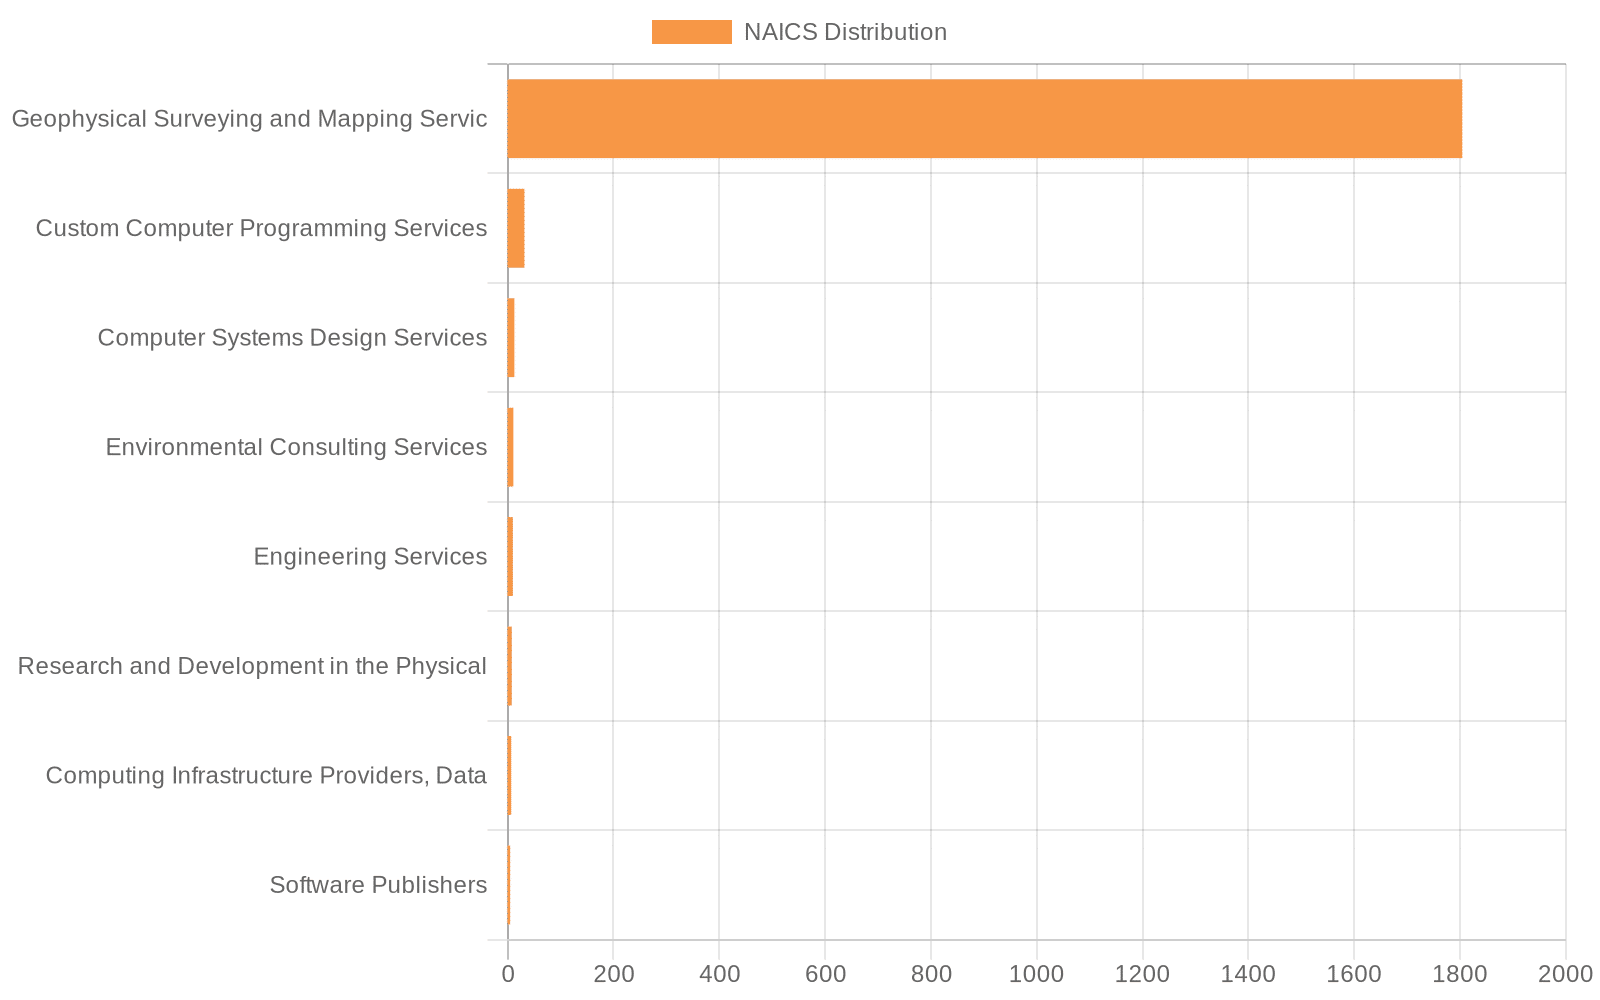
94% of all companies in the dataset are classified under Geophysical Surveying and Mapping Services. The remaining 6% span adjacent categories: Custom Computer Programming Services accounts for 2% (32 companies), Computer Systems Design Services for 1% (roughly 19 companies), Environmental Consulting Services for 1% (11 companies), and Engineering Services for 1% (10 companies).
That spread tells you the industry pulls meaningfully from technology and consulting disciplines alongside its core surveying function. It is worth noting the gap between NAICS classification and actual business activity. 69 companies carry a Custom Programming Services business tag, compared to 32 formally classified under that NAICS code. Many geophysical firms are building proprietary software tools without reclassifying as technology businesses, a quiet but meaningful shift in how value is created in this market.
Employee bands
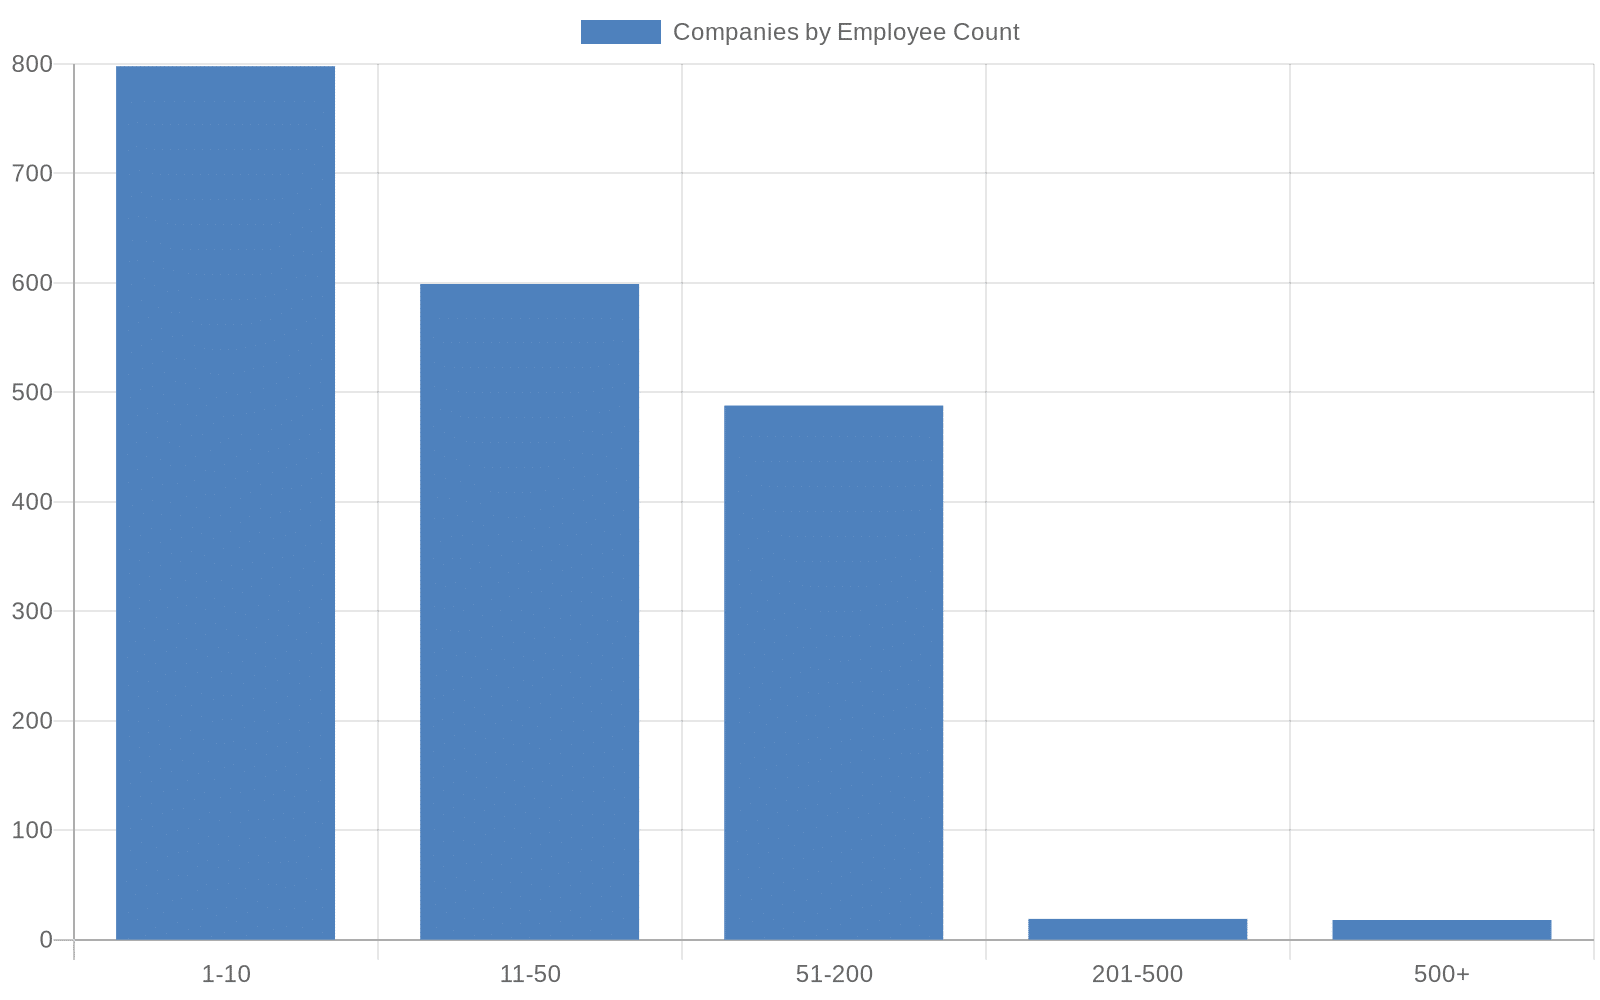
The employee distribution skews sharply toward smaller organizations:
- 1-10 employees: 798 companies, 41% of the total
- 11-50 employees: 599 companies, 31%
- 51-200 employees: 488 companies, 25%
- 201-500 employees: 19 companies, 1%
- 500+ employees: 18 companies, 1%
Over 70% of companies operate with fewer than 50 employees. The market is populated predominantly by specialist boutiques, niche consultancies, and focused technical service providers. Only 37 firms sit at the 201+ employee threshold. This structural reality has direct implications for GTM. You are not selling into procurement departments with 12-week vendor evaluation cycles at most of these companies. You are selling to founders, technical leads, and small leadership teams that make decisions faster and with less bureaucratic overhead.
Kappazeta, at 25 employees, sits comfortably in the 11-50 band, which represents 31% of the market. That is the second-largest employee cohort in the dataset, and it is the cohort where companies typically have enough organizational complexity to need external tools and services, but are not yet large enough to have fully built out internal capabilities.
Revenue bands
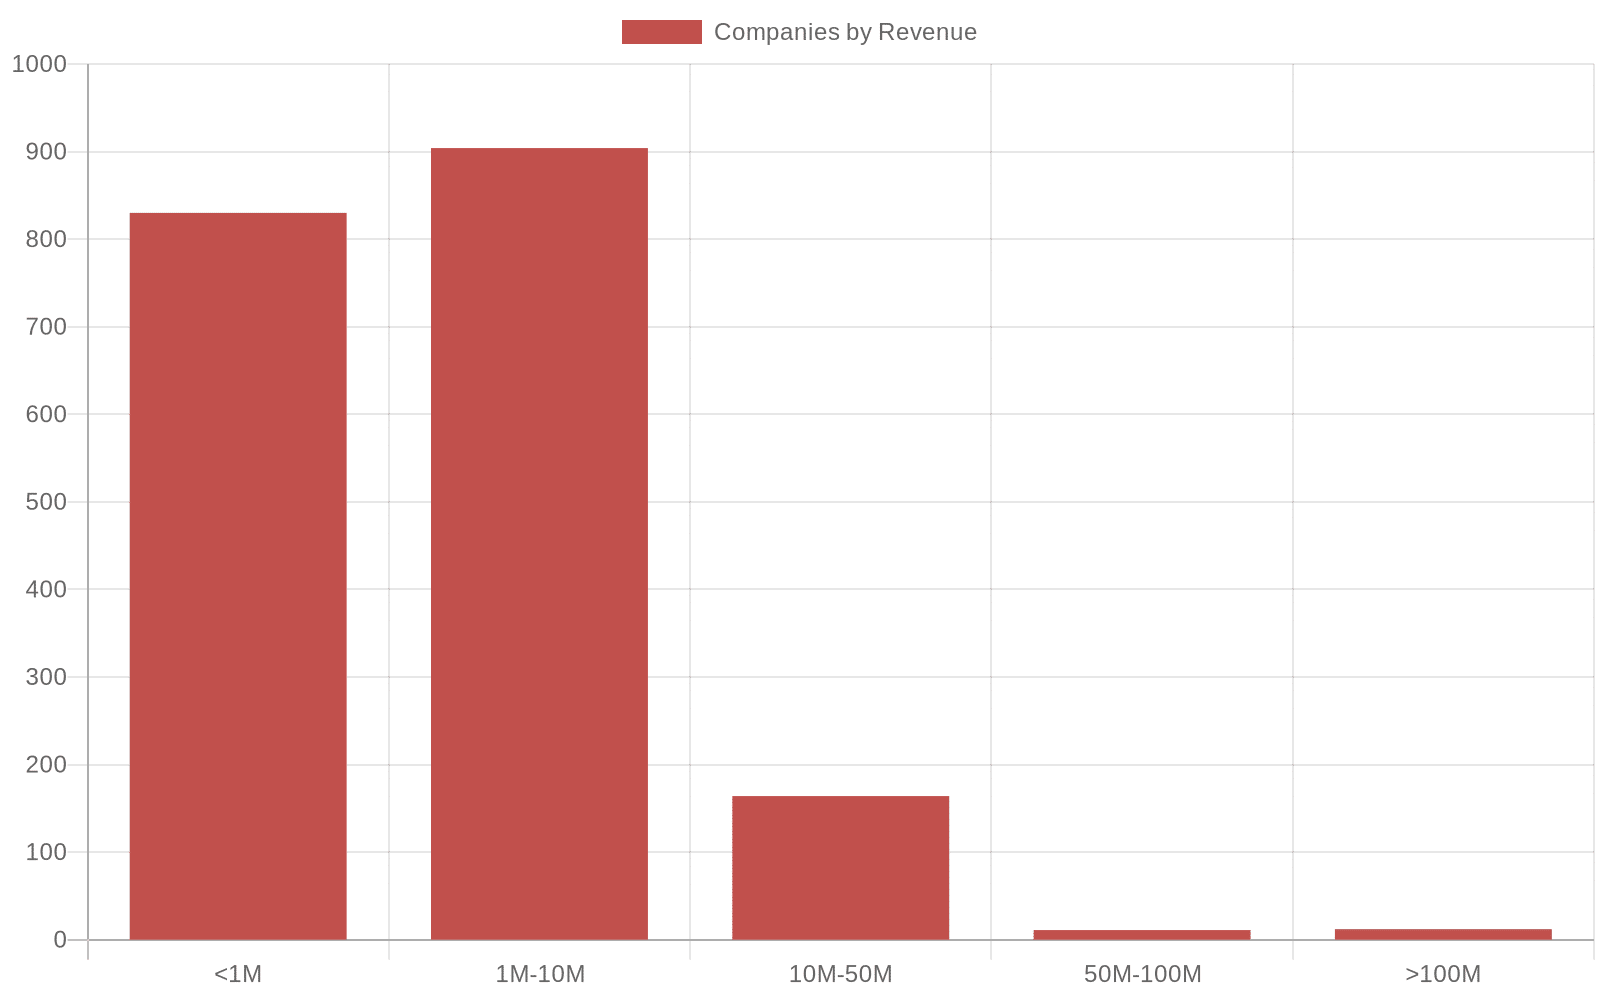
The revenue distribution mirrors the employee picture:
- Under $1M: 830 companies, 43%
- $1M-$10M: 904 companies, 47%
- $10M-$50M: 164 companies, 9%
- $50M-$100M: 11 companies, 1%
- Over $100M: 12 companies, 1%
Nearly 90% of companies generate under $10M in annual revenue. The market’s total of $47.5B is concentrated within a small number of larger players. Only 23 companies exceed $50M in revenue, meaning the top roughly 1% of the sample by size carries a disproportionate share of overall market weight. At an average revenue of approximately $24.7M per company across all 1,922 firms, the average is heavily skewed by that top tier.
Kappazeta’s $1,827,527 in reported revenue places it in the $1M-$10M band, the single largest revenue cohort at 47% of the market. That positioning is relevant: companies in this band have demonstrated commercial traction, often have paying clients and some recurring revenue, but are still at a stage where they are building out systems, partnerships, and go-to-market infrastructure.
—
Geography: where you should focus first
The geographic distribution of this market gives you a clear starting point for prioritizing outreach. The market is well-distributed across Western and Northern Europe, with meaningful representation in Eastern Europe, but it is not evenly spread.
Countries and secondary offices
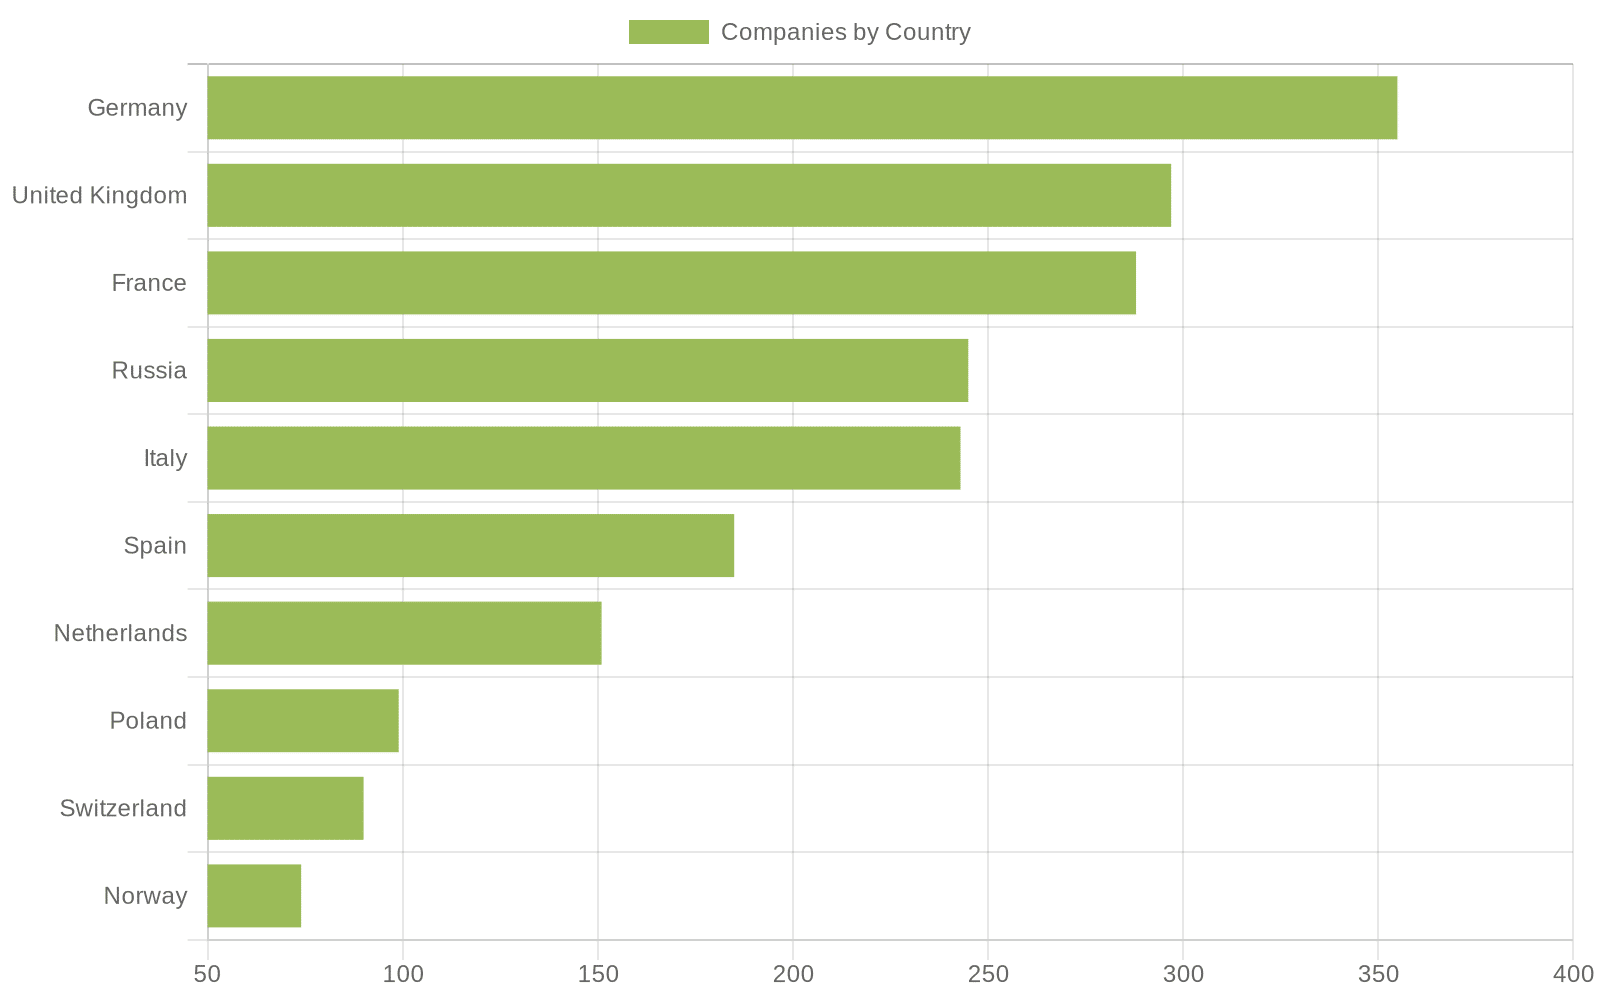
The top five countries by company count are:
- Germany: 355 companies, 18%
- United Kingdom: 297 companies, 15%
- France: 288 companies, 15%
- Russia: 245 companies, 13%
- Italy: 243 companies, 13%
Together, these five countries account for 74% of all 1,922 companies in the dataset. Germany, the UK, and France alone represent 48%, establishing Western Europe as the clear center of commercial density in this market.
The secondary tier is also worth noting. Spain contributes 185 companies (10%), the Netherlands 151 (8%), Poland 99 (5%), Switzerland 90 (5%), and Norway 74 (4%). These are not negligible volumes. If your primary targets in Germany and France become congested, Spain and the Netherlands offer substantial secondary markets with enough company density to sustain a focused outreach program.
It is also worth pausing on the geographic logic behind this distribution. Germany, France, and Italy are among Europe’s largest agricultural economies, each with established crop insurance frameworks and significant land areas under active monitoring. Their concentration in this dataset is not coincidental. The commercial demand for geospatial and earth observation services in those countries is directly tied to agricultural policy, environmental compliance, and insurance infrastructure. That is the connection between industry topic and geography.
Cities and hubs
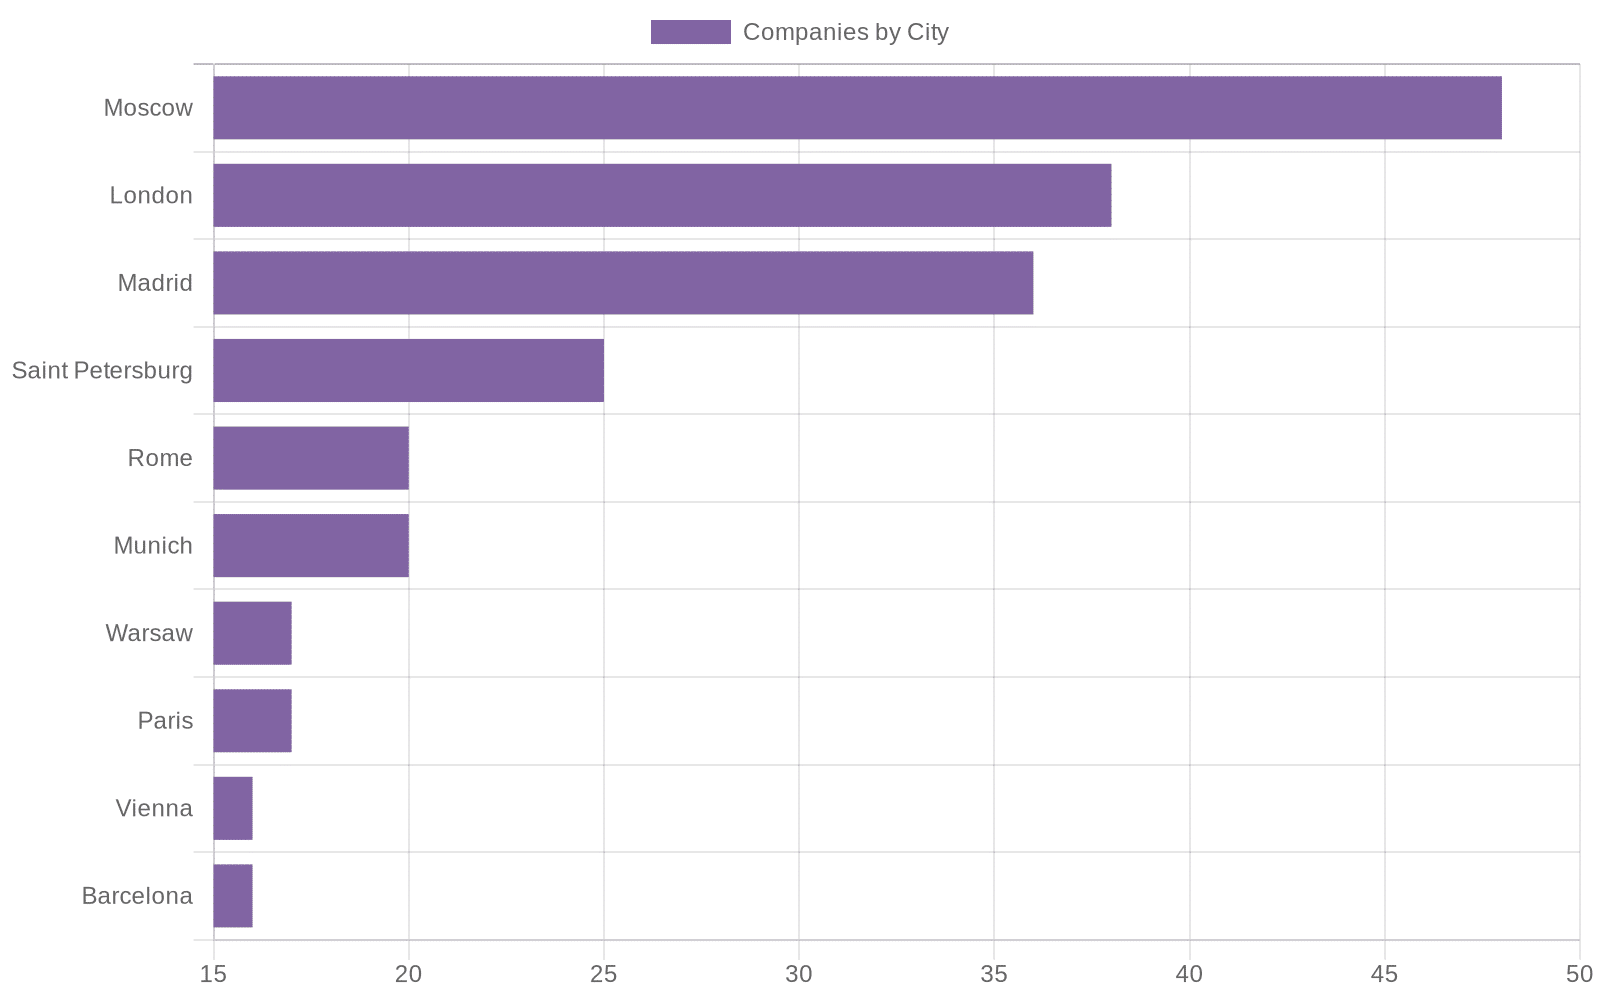
At the city level, no single hub dominates decisively:
- Moscow: 48 companies, 2%
- London: 38 companies, 2%
- Madrid: 36 companies, 2%
- Saint Petersburg: 25 companies, 1%
- Rome: 20 companies, 1%
The relatively even distribution across cities, where no city exceeds 2% of the total sample, is structurally distinct from what you see in fintech or B2B SaaS, where London or Amsterdam tend to pull significant market concentration. In this market, proximity to specific geographic terrain, agricultural zones, or national government contracts shapes company location decisions more than access to a single innovation cluster.
For practical GTM purposes, this means city-level targeting is less useful here than country-level or sector-level targeting. You are better served filtering by country and topic tag than by city alone.
Technology and problem space: what this market cares about
The capability signals in this dataset point clearly toward a market in transition. Data interpretation and software-enabled service delivery are becoming the primary sources of value, while raw data acquisition and field-based measurement become commoditized inputs.
Data Analysis Services is the strongest single capability signal: 127 companies, 7% of the market, carry this tag. As earth observation datasets grow in volume and resolution, the ability to process and interpret that data is increasingly where margin is captured. Clients are not paying premium prices for access to satellite imagery. They are paying for the interpretation layer that turns imagery into decisions.
Remote Sensing surfaces as a distinct commercial offering for 75 companies (4%), rather than a purely technical method embedded in service delivery. This signals growing client demand for satellite and aerial data products that go beyond raw imagery into interpreted, decision-ready outputs.
Research and Development appears as a business tag for 77 companies (4%), while only 8 companies carry a formal R&D NAICS classification. That gap follows the same pattern seen with software: active research conducted without formal classification, concentrated in areas like sensor technology, algorithmic interpretation, and automation of monitoring workflows.
Custom Programming Services is tagged across 69 companies (4%) against only 32 formally classified under the corresponding NAICS code. Many geophysical firms are building proprietary software tools internally, which signals that differentiation in this market is increasingly a function of what proprietary tooling a firm has built on top of its core data capabilities.
Project Management Services is the second most common business tag at 9% (174 companies), with Project Management alone accounting for another 5% (101 companies). The inclusion of Development Management and Project Management in the keyword filter for this dataset confirms that a significant share of this market operates at the intersection of technical surveying and the management of complex, multi-stakeholder programs, including land development, infrastructure assessment, and agricultural improvement applications.
At the engineering and consulting layer, Engineering Services (6%, 106 companies), Geotechnical (5%, 87 companies), Engineering and Consulting (4%, 77 companies), and Civil Engineering Services (3%, 64 companies) collectively represent a substantial practice built on top of core geospatial data work. As regulatory requirements around land use and environmental impact tighten across the EU, firms that combine surveying with compliance-oriented consulting are positioned to capture that growing demand.
Finally, Automation & Monitoring is one of the explicit keyword filters for this export. With 798 companies operating in the 1-10 employee range and 599 in the 11-50 range, the majority of participants operate at a scale where automation is not optional but structurally necessary for margin preservation. Small teams delivering data monitoring services at scale must rely on automated pipelines, and this dynamic is accelerating investment in tooling across the segment.
Top 10 interesting insights & Market dynamics and trends
1. The market is structurally fragmented with no dominant player.
73% of companies (1,397) employ fewer than 50 people, and only 37 firms sit at the 201+ employee threshold. With $47.5B in total revenue distributed across 1,922 companies, there is no single player controlling outsized share across the board. Fragmentation creates opportunity for new entrants to establish positions before consolidation accelerates.
2. Revenue concentration sits with a very thin top tier.
Only 23 companies generate over $50M in revenue. That top 1% carries a disproportionate share of the market’s total $47.5B. The remaining 99% of companies are operating in a volume-driven, often project-based revenue model where contract size and pipeline consistency matter enormously.
3. The $1M-$10M band is the commercial core.
904 companies, 47% of the market, sit in the $1M-$10M revenue range. This is the most commercially active segment, companies with paying clients, demonstrated demand, and limited internal resources. It is also the segment where external tools, data services, and GTM support generate the clearest return on investment.
4. Western Europe is the gravitational center.
Germany, France, and Italy are not just the three largest country representations in the dataset. They are three of Europe’s largest agricultural economies. Their combined 46% of company count (combining Germany at 18%, France at 15%, and Italy at 13%) reflects both the depth of their geospatial sectors and the commercial demand generated by agricultural risk management, land monitoring, and environmental compliance.
5. Data interpretation has overtaken data collection as the primary value driver.
127 companies (7%) carry a Data Analysis Services tag, and 75 companies (4%) position Remote Sensing as a commercial offering rather than a technical method. The market has moved past the era where having access to satellite data was the differentiator. What clients pay for now is what you do with that data.
6. Software is being built without formal reclassification.
The gap between 69 companies tagged as Custom Programming Services and 32 formally classified under the corresponding NAICS code is a structural signal. Geophysical firms are building proprietary software without repositioning themselves as technology businesses. That creates a product category where the lines between services firm and software company are increasingly blurred.
7. Agricultural use cases are driving the topic expansion.
The keyword filter for this dataset explicitly targets Crop Insurance, Agricultural Insurance, and Hail Damage alongside Earth Observation and Automation & Monitoring. The concentration of companies in Germany, France, and Italy, all major agricultural economies with active insurance frameworks, confirms that agricultural risk assessment is a real and growing commercial pull for geospatial data capabilities, not a speculative one.
8. Project management is embedded in this market at scale.
Project Management Services is tagged across 174 companies (9%), making it the second most common business tag in the dataset. This is not a peripheral capability. It reflects that surveying and earth observation work is delivered inside complex, multi-stakeholder programs where project coordination is a core competency rather than an afterthought.
9. No city dominates. Location follows demand, not clustering.
No city exceeds 2% of total company count. Moscow at 48 companies, London at 38, and Madrid at 36 are the top three, but none create the kind of gravitational pull you see in fintech or SaaS hubs. Company location in this market follows terrain, agricultural zones, and government contract geography, which means GTM targeting by country and topic is more effective than city-level filtering.
10. A 1% penetration scenario is worth quantifying.
At an average revenue of approximately $24.7M per company across 1,922 firms, a 1% penetration scenario targeting 19 companies translates to a ~$469M addressable revenue pool. That figure rises substantially when weighted toward the 164 companies in the $10M-$50M revenue tier, which represent the highest-value, highest-activity segment for enterprise-level solutions.
Conclusions
This market is real, sizable, and structurally accessible. 1,922 companies generating $47.5B in total revenue across the EU, with 90% of them sitting below $10M in annual revenue, is not a market controlled by a handful of incumbents. It is a fragmented, specialist-driven landscape where positioning clarity and targeted outreach generate outsize returns.
The structural shift from field-based measurement to API-delivered, software-integrated data services is already underway. The capability tags across the dataset confirm it. The revenue concentration in a thin top tier confirms the fragmentation. The geographic concentration in Germany, France, and Italy confirms where agricultural and geospatial demand is commercially densest.
Kappazeta, at 25 employees and $1,827,527 in revenue, is not a market outlier. It is a precise representation of the 11-50 employee, $1M-$10M revenue cohort that makes up the commercial core of this market. Understanding what Kappazeta does, how it does it, and where it sits in the competitive structure gives you a concrete reference point for any GTM decision in this space.
Building your ICP for this market
The data from this dataset support two distinct ICP profiles. Neither is speculative. Both are grounded in the size, revenue, geography, and capability patterns documented across 1,922 companies.
Here are two ICP examples grounded in the data:
ICP 1 Example based on the data
Profile: The specialist SMB in Western Europe’s agricultural core
- Company size: 11-50 employees (31% of the market)
- Revenue: $1M-$10M (47% of the market)
- Geography: Germany, France, or Italy (combined 46% of company count)
- NAICS: 541360, Geophysical Surveying and Mapping Services
- Business tags: Earth Observation, Crop Insurance, Agricultural Insurance, Data Analysis Services, Remote Sensing
- Operational profile: A firm delivering interpreted satellite data or field intelligence to agricultural insurers, land management bodies, or public agricultural agencies. The team is small enough that automation is a necessity for maintaining service delivery at scale. The company has commercial traction but limited internal bandwidth for building out new tooling, workflows, or GTM systems.
- Why this ICP fits the data: The $1M-$10M band at 904 companies is the single largest revenue cohort. Germany, France, and Italy represent the three largest agricultural economies in the dataset. The Data Analysis Services and Remote Sensing tags confirm the commercial direction of firms in this cluster.
ICP 2 Example based on the data
Profile: The mid-market technical consultancy with software ambitions
- Company size: 51-200 employees (25% of the market)
- Revenue: $10M-$50M (9% of the market, 164 companies)
- Geography: Germany, UK, France, Spain, or the Netherlands
- NAICS: 541360 primary, with secondary presence in Custom Computer Programming Services or Engineering Services
- Business tags: Custom Programming Services, Project Management Services, Data Analysis Services, R&D, Engineering and Consulting
- Operational profile: A firm that combines core geospatial surveying capabilities with proprietary software development and multi-stakeholder project delivery. The company is generating enough revenue to invest in product development but is still building out the formal infrastructure of a software business. It operates across multiple EU markets and likely has involvement in land development, infrastructure assessment, or EU-funded agricultural improvement programs.
- Why this ICP fits the data: The $10M-$50M cohort at 164 companies represents the highest-value accessible segment below the 23-company top tier. The gap between Custom Programming Services business tags (69 companies) and formal NAICS classification (32 companies) confirms this profile is common. Project Management Services at 174 companies (9%) confirms multi-stakeholder program delivery as a structural characteristic of firms at this revenue level.
Go-to-market strategies: what to do with this
The structure of this market gives you clear direction on where to start, how to sequence your approach, and what kind of positioning actually fits the buyer.
Start with the $1M-$10M band in Western Europe.
This is the highest-volume, highest-density segment in the dataset. 904 companies generating between $1M and $10M in annual revenue, concentrated in Germany, France, and Italy, represent the most accessible entry point. These companies have commercial traction and budget, but limited internal resources. A solution that reduces the burden of data processing, monitoring automation, or GTM infrastructure will resonate with teams that are already stretched.
Use capability tags, not just NAICS codes, to find the right buyers.
NAICS 541360 covers 94% of this market, which makes it a broad filter but not a precise one. The tags that signal genuine commercial alignment are Data Analysis Services, Remote Sensing, Crop Insurance, Agricultural Insurance, and Custom Programming Services. Build your outreach lists by combining NAICS with at least two of these tags to isolate firms whose actual business activity matches your offer, not just their formal classification.
Sequence outreach by country, starting with Germany and France.
Germany at 355 companies and France at 288 are the two largest markets by company count and are both top-tier agricultural economies with active crop insurance and land monitoring demand. These markets have the density to support a sustained outreach program and the commercial context to make the business case for geospatial data services straightforward. The UK at 297 companies is a strong parallel target, particularly for firms with English-language content and sales infrastructure already in place.
Position around the automation constraint, not the data product.
With 73% of companies employing fewer than 50 people, most of your buyers are operating with small teams. The structural argument for automation is not an aspiration for these companies. It is a survival mechanism. Frame your offer around what it removes from the workload rather than what it adds to the capability stack. Small teams in data-intensive services do not need more tools. They need fewer manual steps.
Target the $10M-$50M cohort separately, with a different message.
The 164 companies in this band are at a different stage. They have the budget to invest in product development, multi-country operations, and more sophisticated tooling. The presence of Custom Programming Services and R&D tags in this segment means they are already building. Your positioning here should be about integration, acceleration, or market intelligence that informs their product decisions rather than a replacement for internal capability.
Use content to establish category presence before direct outreach.
This market is geographically distributed with no dominant hub city. That means event-based or city-specific marketing has limited reach. Content that addresses real operational problems, near-real-time agricultural damage detection, radar versus optical data trade-offs, crop insurance data standards, draws in exactly the technical decision-makers who influence purchase decisions in this space. SEO and GEO together give you a presence that works across geographies without requiring in-market presence in every country.
Do not skip Spain and the Netherlands.
Spain at 185 companies and the Netherlands at 151 are large enough to sustain focused secondary campaigns. Both countries have significant agricultural sectors and active environmental monitoring programs. If your primary Western European campaigns in Germany and France are performing, these two markets are the natural next tier.
Conclusion: should you target this market and how
Yes, if the structural fit is there.
A $47.5B market with 1,922 active companies, the majority of them small, distributed across Western Europe, and increasingly dependent on data interpretation and software automation, is a real commercial opportunity. It is not dominated by a handful of players. It does not require market creation. The demand is established.
The question is whether your offer fits the buyer profile. If you are selling data services, GTM tools, marketing infrastructure, automation workflows, or technical consulting to companies in the $1M-$10M or $10M-$50M range with fewer than 200 employees, this market is a match. If your minimum viable deal size requires a $50M+ annual revenue client, your addressable pool is 23 companies, which is a narrow and competitive target set.
The practical advice is this: start with Germany and France, use capability tags to filter your list, lead with the automation and efficiency argument, and build content that positions you as a credible voice in the geospatial and agricultural intelligence space before your sales team makes the first call. The market is large, the companies are accessible, and the buying context is clear enough to build a precise, data-grounded outreach strategy around.
Want more clients in the EU‘s geospatial, agricultural intelligence, and earth observation space? Here’s how Milk & Cookies Studio can help.
This market covers 1,922 companies generating $47.5B in total revenue across the EU, spanning Geophysical Surveying, Earth Observation, Crop Insurance, and related segments. That means real buyers, real budgets, and real opportunities for the right go-to-market approach.
At Milk & Cookies Studio, we build the systems that get you in front of the right companies in this space. Here is what that looks like in practice:
- GTM strategy: A go-to-market strategy is your plan for reaching the right buyers in the right markets. We build GTM strategies tailored to the Surveying Services space, so you know exactly who to target and how to reach them.
- Lead generation: Lead generation means finding and attracting potential clients who are likely to buy from you. We identify and engage decision-makers across the 355 companies in Germany, 297 in the UK, and 288 in France that make up the top three country concentrations in this market.
- Demand generation: Demand generation builds awareness and interest in your product or service before a buyer is ready to talk to sales. We create programs that keep your brand visible to the 94% of this market classified under Geophysical Surveying and Mapping Services.
- Full funnel marketing: Full funnel marketing means running campaigns that cover every stage of the buyer journey, from first awareness to closed deal. We align messaging and tactics to move buyers through each stage efficiently.
- Content marketing (SEO & GEO): SEO (Search Engine Optimization) helps buyers find you on Google. GEO (Generative Engine Optimization) helps your brand appear in AI-generated answers. We produce content that works across both, so you stay visible wherever your buyers are searching.
If you are targeting the Surveying Services space, Milk & Cookies Studio is ready to build your pipeline. Reach out and let’s get started.